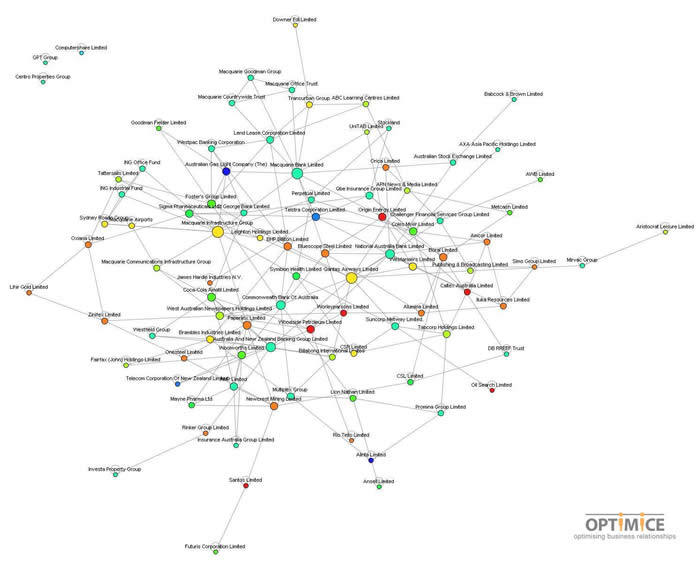
Industry: Australian Stock Exchange Data: ASX 100 board of directors register (note ONLY ASX 100 companies are included in the map).
Treatment: The map shows those firms that are connected through a common board member. The colours denote the industry sector of boards their board members sit on.
Commentary: Mapping board interlocks has been a popular exercise since the 1970s. This Australian Stock Exchange map shows a healthy (or unhealthy) interconnection between firms through common board members. The interconnections could be healthy if they bring a diversity of experience to the table. They might be unhealthy if they lead to uncompetitive behaviour, potentially attracting the attention of the regulators. This doesn’t appear to be the case here, with the board interlocks often spanning industry sectors.
(Click to enlarge)