Interdependencies between projects create complexities for the management of project portfolios. In times of uncertainty this challenge is even greater due to the difficulties in predicting the flow-on effects from changes to projects in the portfolio. Hence, in times of disruptive change a good understanding of project interdependencies is particularly important.
OptimiceandUniversity of Technology Sydney(UTS) have been conducting research which aim to improve the understanding and management of interdependencies withinproject portfolios.
In a one dimensional world all projects in a portfolio are equally important. However, Portfolio Managers know that there are often numerous critical linkages, or interdependencies, between projects which means that some projects have have bigger potential to cause wider disruption than others.
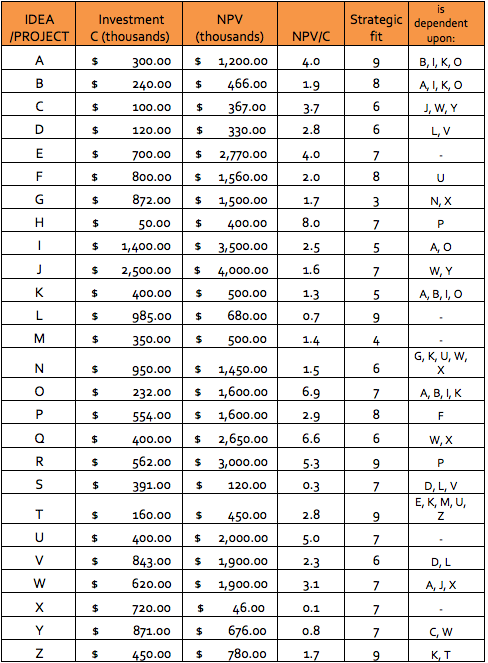
Traditional listing of projects and interdependencies provides a one dimensional view. The table below provides a list of a project portfolio totalling some $16m:
Now compare the table above with the map of project interdependencies on the right. The maps show how projects in a portfolio are linked through interdependencies. The 'domino effect' means that delays quickly spread throughout the portfolio.
Exploring the map
The map below shows the interdependencies between projects in a project portfolio.
Arrows represent dependency, e.g. project R (big red) depends on project P (medium orange)
Double-click on a project to see all the projects that rely on it.
Projects are color-coded by strategic fit
The data behind the map is collected using Optimice'sONA Surveystool, but could also be based on an interface into a project portfolio management system. The map dynamically generated and presented in an format which allows users to analyse the portfolio and make management decisions based on facts.
Contact usif you are interested in mapping the interdependencies in your organisation's project portfolio.