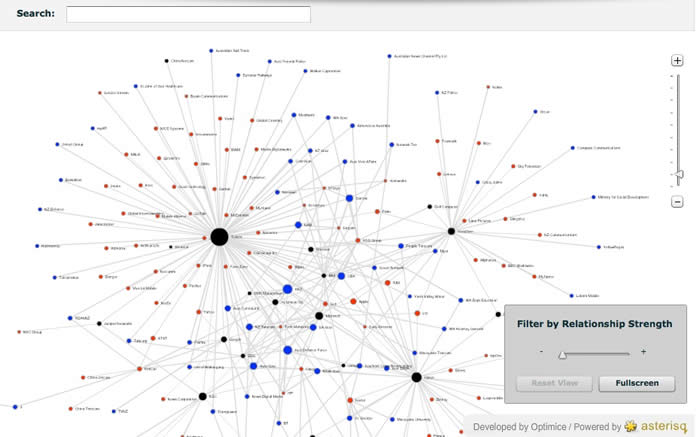
Visual Markets is as it suggests, a visualisation of a market place showing how suppliers are connected to customers or how suppliers are connected to other suppliers via product channels or supply chains. These powerful visualisation techniques can for the first time allow market place actors to see the full extent of the competitive environment. By understanding how the market place is structured, one can move to a whole new level of market intelligence, far beyond simple market share analyses.
Vendors are able to see how they are positioned against the competition, what the impacts of alliances might be having on the competitive dynamics and what opportunities might exist for improving their competitive position in the market place. Major product vendors can assess how effective their channel partners are placed. Are they overlapping? Are there under serviced gaps in the market place?
Customers can see the full complexity of the vendor side of the market. Which vendors are regular alliance partners? What collection of vendors are other firms like yourself employing? Which vendors appear over stretched and therefore potentially a risk? Which vendors should form part of your multisourced procurement strategy?
The Method Behind Visual Markets
The maps are created using methods developed by Optimice Pty Ltd based on social network analysis (SNA) techniques. The nodes in the maps are firms which are typically distinguished as vendors or clients by their colouring and/or shape. The connections between firms can represent existing contracts, alliance relationships or even key executive connections.
The market map provides a visual; interface into an underpinning intelligence data base. Different maps can be generated for subsets of vendor types e.g. IT applications, IT infrastructure, Telecommunications or client industry sectors e.g. Financial Services, Manufacturing etc.. Individual firms can be extracted with only their particular community of customers and alliance partners showing.
Firms can be artificially "merged" or firms removed from the map to see the effect on the nature of the market place. While it easy to determine who the major players are, it is not as obvious to identify firms that bridge clusters in the market place. For example, if your firm is looking to expand from say the manufacturing sector into the health sector it might be important to identify potential partners or clients that can bridge between the two sectors.
Why Visual Markets?
For multisourcing customers it may be important for you to know that your vendors have a history of co-operation than fierce competition.
We identify the contractual and partnering relationship between vendors and their clients.
We make competitive position visible.
We provide unique market insights not previously possible with traditional techniques.
Insights for Vendors
For the first time allow market place actors to see the full extent of the competitive environment.
By understanding how the market place is structured, readers can move to a whole new level of market intelligence, far beyond simple market share analysis.
Vendors are able to see how they are positioned against the competition.
Major product vendors can assess how effective their channel partners are placed.
Insights for Clients
Customers can see the full complexity of the vendor side of the market. Are they overlapping? Are there under-serviced gaps in the market place?
Which vendors are regular alliance partners?
What collection of vendors are other firms like yourself employing?
Which vendors appear over stretched and therefore potentially a risk? Which vendors should form part of your multisourced procurement strategy?